


Re-occupancy Guidelines Established for Spray Foam Installation

Revision – February 2011
Bayer Material Science submits this revised paper due to inaccuracies reported in the original paper (October 2010). Specifically, the predicted indoor air concentrations shown for formaldehyde for Bayseal CC in the original paper (Table 1) were not background-corrected. The predicted indoor air concentrations shown in this revised report reflect the background-correction; therefore, the predicted indoor air concentrations for formaldehyde for Bayseal CC are lower than the values presented in the original paper. A second change is that the California OEHHA Indoor REL for formaldehyde is referenced in Tables 1 and 2 rather than the OEL. The recommended re-occupancy times remain unchanged.
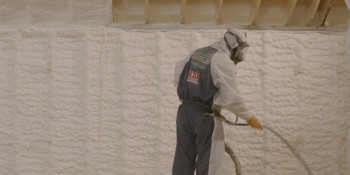
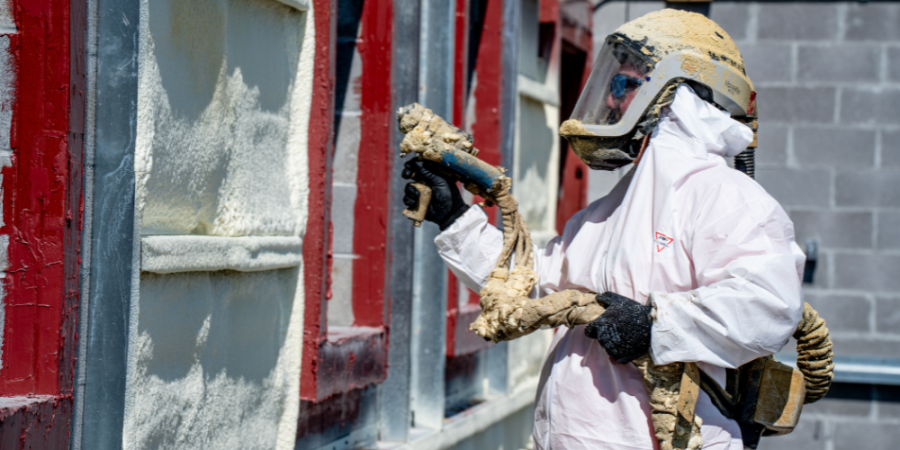
SPRING, TEXAS - March 22, 2011 - A re-occupancy guideline defines the period in time after spray polyurethane foam (SPF) installation at which the building can be reoccupied by other workers, building occupants, or residents. The following factors need to be considered when developing a re-occupancy guideline: (1) identification of chemical components that off gas, including the concentration and duration of emanation, (2) assessment of these components with respect to known health hazard information available on the Material Safety Data Sheet (MSDS) or other sources, (3) the ratio of the coverage area of the insulation to the volume of the spray area (4) the level of ventilation or fresh air exchange in the structure, and (5) the type of population that will first re-occupy the structure.
In this work we propose a methodology for developing a re-occupancy guideline that integrates the above factors into the analysis. The methodology has many similarities to the Center for the Polyurethanes Industry / Spray Polyurethane Foam Alliance SPF Insulation Emissions Testing Protocol, which is currently in draft form. That methodology was the subject of a technical paper prepared for the 2008 CPI conference.
The SPF systems used for this analysis were Bayseal CC, a closed cell foam, and Bayseal OC, an open cell foam. The re-occupancy guidelines for both Bayseal CC and Bayseal OC foams developed from this methodology are as follows: 12 hours for trades workers, and 24 hours for all others(e.g., residents, tenants, etc.). It is of note that methylene diphenyl diisocyanate (MDI) was not detected at any time point for either Bayseal CC or OC foam. The re-occupancy guidelines developed in this work are product specific. Recommendations for other re-occupancy guidelines for other SPF systems should be developed based on their unique emissions profiles.
BACKGROUND
To begin, it is important to provide a brief description of the typical two-component high pressure SPF system. SPF is formed from the combination of “A” side and “B” side materials. The “A” side is known as polymeric methylene diphenyl diisocyanate (PMDI) and consists of approximately equal amounts of monomeric MDI and higher molecular weight oligomers of MDI. The “B” side is a polyol blend which typically contains base polyols, catalysts, blowing agents, surfactants, flame retardants, and other additives. The A and B sides are typically housed in 55 gallon drums in the SPF spray rig, heated to approximately 110 – 130 degrees F in the dispensing unit, and then delivered via separate hoses to a pneumatic spray gun, where they are mixed by high pressure impingement, and then discharged as a spray of reacting foam onto the desired substrate (e.g., oriented strand board in a wall cavity). The reaction to form polyurethane foam takes only several seconds. Some of the compounds in the A and B sides are expected to exist in the foam unchanged (e.g., certain catalysts, blowing agents), and therefore can potentially be emitted from the installed foam. Other components will react to form polyurethane (base polyols, MDI, PMDI) or will react into the structure of the foam (e.g., certain catalysts); these components therefore are not anticipated to be available for emission from the installed foam.
It is typically recommended that entire residential and smaller commercial buildings, or portions of large commercial buildings, be vacated by building occupants during the installation of SPF due to the potential hazards presented by the unreacted chemicals used to make the SPF. Furthermore, SPF, like many other new building materials, can emit low levels of various chemicals for a short period of time following installation. Therefore, the time at which people (e.g., next trade, homeowner, tenant, etc.) can reoccupy a building following the completion of SPF installation is an important consideration. This paper describes the methodology used to arrive at a re-occupancy guideline for two Baysystems spray polyurethane foam (SPF) insulation products, Bayseal CC, a closed cell SPF product with nominal density of approximately 2.0 pcf (pounds per cubic foot), and Bayseal OC, an open cell SPF product with nominal density of 0.5 pcf. The methodology followed for this work has many similarities to the methodology that is described in the draft Center for the Polyurethanes Industry/Spray Polyurethane Foam Alliance SPF Insulation Emissions Testing Protocol. That protocol was the subject of a technical paper that was prepared for the 2008 CPI conference.
METHODOLOGY
FOAM SAMPLE PREPARATION
Typical high pressure SPF equipment was used to prepare the foam samples at Bayer MaterialScience (BMS) in Pittsburgh. The following Graco brand equipment was used: T2 transfer pumps, H-XP2 Reactor with 120 series pumps (proportioner), and a Fusion AP air purge spray gun with an AR4242 mix chamber. The A-side material used for both open and closed cell foams was the isocyanate used in Bayseal foam-forming systems, while the B-side material was the polyol component of either the Bayseal CC or Bayseal OC foam-forming system for the closed cell and open cell foam, respectively.
The B-side material was adequately mixed prior to spraying. The spray equipment was flushed with the A- and B-side chemicals for a period of about 90 seconds before spraying. Approximately 1 gallon of product was then sprayed through the gun. These steps were taken so that any potential residuals from previously-sprayed products did not contaminate the sample.
Following these steps, the SPF samples were sprayed. The samples were sprayed indoors at room temperature. The A- and B-side temperatures in the proportioner and supply hoses were set at 110-120 degrees Fahrenheit, and dynamic pressure was approximately 1100-1200 psi. The SPF was applied into a 18"X18"X6” cardboard box that had aluminum tape on the bottom.
The closed cell foam was applied to a thickness of approximately 2 inches in one pass, while the open cell foam was applied to a thickness of about 4 inches, also in one pass. Three samples of each foam type were prepared in this fashion. After one hour, the SPF was separated/removed from the box in which it was sprayed, and a band saw was used to cut out a sample with the dimensions of approximately 5 inches by 5 inches. The top surface/skin of the closed cell foam samples were not disturbed, as the skin is not typically removed in real world applications. The top surface of the open cell foam samples was removed with the band saw to produce samples that were approximately 3 1⁄2” in thickness. This is the typical practice for open cell SPF installed in wall cavities.
Thin (< 1/16”) pieces of galvanized steel and aluminum tape were then used to construct a sample holder around the foam sample, leaving only the top surface exposed, similar to the manner in which SPF exists in wall cavities in actual buildings. Prior to use, the galvanized steel was cleaned using powdered lab soap and water to remove any oils or other contaminants. This technique of constructing the holder around the sample resulted in a sample holder that fit as tightly as possible to the foam sample, reducing the likelihood of emissions from the sides and bottom of the foam sample.
The prepared foam samples were submitted to the BMS Environmental Analytics Laboratory within two hours after being sprayed. An empty holder was also submitted.
SMALL SCALE ENVIRONMENTAL CHAMBER DETAILS
Upon receipt at the laboratory, each SPF sample and the empty holder were placed in individual small scale environmental chambers.
The chambers were constructed of acrylic that had been lined with aluminum backed PTFE film (BYTAC® tape available from Saint-Gobain Performance Plastics Corporation). Each chamber was fitted with a sample port, air inlet, and air outlet. The chambers were made to be as air tight as possible using sealing tape and 2.5” foil tape. The internal volume of the chambers was measured to be 35.4 liters. In addition to these chambers, a stainless steel chamber of a similar volume and configuration was also used for some analytes.
The loading factor, which is the ratio of surface area of the exposed face of the SPF sample to the chamber volume, was 0.5 m2/m3. This loading factor is prescribed in the Underwriters’ Laboratories of Canada document Standard Laboratory Guide for the Determination of Volatile Organic Compound Emissions from Polyurethane Foam (CAN/ULC-S774-09), and is thought to be representative of a typical residential structure.
Three chambers contained a foam sample in a holder. A fourth chamber contained only an emptysampleholder. Allthechamberswereplacedinanincubatorwhichwassetat23°Cfor the duration of the testing. Humidity was controlled at 50% using an open tray containing a saturated solution of magnesium nitrate, and humidity was monitored with a NIST traceable hygrometer. Air was drawn through the chambers using a Gilian Aircon2 sampling pump fitted with a splitter/flow restrictor to draw laboratory air through each chamber at a rate of approximately 600 cc per minute (1 chamber volume per hour). An activated carbon trap was placed in-line on the inlet to remove VOCs from the air entering the chambers. The chambers were configured such that the air was introduced near the midpoint (vertically) of one side of the chamber, and drawn out at a point within approximately 2.5 inches above the top of the sample holder, which was located on the other side of the chamber. Sampling pumps were calibrated using a Bios International DryCal® Flowmeter.
SAMPLING AND ANALYTICAL TECHNIQUES
Air samples were collected for the general categories of volatile organic compounds and aldehydes, as well as compounds specific to SPF, including amine catalysts specific to the formulation, 4,4’-methylene diphenyl diisocyanate (MDI), higher molecular weight oligomers of MDI (molecules containing greater than two methylene-linked-phenyl rings, where each phenyl ring has an isocyanate group and methylene link(s) to one or two other phenyl rings). For the closed cell foam samples, sampling was also conducted for the blowing agent (1,1,1,3,3- pentafluoropropane).
Air samples were collected from the chamber at approximately the following times following introduction to the chamber: 4, 12, and 24 hours, and then at days 2 and 4. Sampling was conducted on multiple additional days up to day 20 for the open cell foam samples.
Due to the number of different types of analytes, simultaneous sampling was not possible; rather, sampling was staggered, meaning sampling for one analyte type was conducted followed by sampling for another. Sample flow rates were no greater than the chamber air flow rate.
All air sampling and analysis was conducted by the BMS Environmental Analytics Laboratory and the BMS Industrial Hygiene Laboratory. The BMS Industrial Hygiene Laboratory is accredited by the American Industrial Hygiene Association (AIHA).
An Agilent 6890/5973 Gas Chromatograph – Mass Spectrometer (GC-MS) system fitted with an Entech 7100A preconcentrator was used to analyze VOCs. The target compounds were calibrated with gas standards (US EPA TO-15 list). A 20 to 40 cubic centimeter sample of air was extracted from the chamber sampling port, concentrated cryogenically, and subsequently analyzed.
Formaldehyde and acetaldehyde samples were collected from the chamber exhaust stream using 2,4-dinitrophenylhydrazine (DNPH) coated silica gel tubes and subsequently analyzed by High Performance Liquid Chromatography with UV detection. using method ASTM D 5197-03 (EPA Method IP-6A).
Amine catalyst samples were collected from the chamber exhaust stream using XAD-2 tube (SKC, Inc. cat. no. 226-30-06). The tubes, front and back sections, were desorbed in acetone and analyzed by BMS Method 2.10.3, which uses a GC with a nitrogen-phosphorus detector (NPD).
Blowing agent (1,1,1,3,3-Pentafluoropropane) samples were measured using the Agilent GC-MS previously described. Previous study by BMS had demonstrated good agreement between the Agilent GC-MS method and BMS Method 3.53.0 (a modified version of NIOSH Method 2516) which utilizes charcoal tube sampling media and a GC-Flame Ionization Detector (FID) analytical technique.
MDI (and higher molecular weight MDI oligomers) samples were collected using a 13 mm glass fiber filter treated with 1-(2-pyridyl)piperazine and diethyl phthalate housed in a Millipore Swinnex® cassette in accordance with BMS Method 1.7.7. In this method, isocyanates react with the amine reagent to form urea derivatives. The urea derivatives are then eluted from the sampling media with HPLC-grade acetonitrile/dimethylsulfoxide (90/10 volume/volume). The samples are then analyzed using HPLC with UV detection. It is of note that both the acrylic and stainless steel chambers were used for the MDI and polymeric MDI sampling. This was done due to concerns that the MDI/pMDI, if emitted, might adsorb to the PTFE surfaces. It was thought that stainless steel may be less likely to result in potential adsorption effects.
RESULTS AND DISCUSSION
GENERAL
For each air sample that was collected, a chamber concentration was calculated based on the mass of analyte identified per sample and the volume of air that was sampled. Each result was then converted to an emission factor. Emission factors were calculated based on the chamber concentrations, foam sample surface area, and chamber air flow rate, as follows:
Emission Factor (EF, in ug/m2 hr) = ((chamber concentration in ug/m3) / (loading factor in m2/m3)) * (air changes per hour)
This can be reduced to: EF = ((chamber concentration in ug/m3) / (0.5 m2/m3)) * (1.0 air changes per hour)
The emission factors were then used to derive a predicted indoor air concentration assuming an air exchange rate of 0.3 air changes per hour using the following equation:
C = EF (0.5 m2/m3) (1/0.3)
where, C = predicted indoor air concentration in micrograms per cubic meter (ug/m3) EF = emission factor in ug/m2 hr
It is thought that 0.3 air changes per hour is a conservative air exchange rate, and that it is representative of a fairly air-tight residential structure. This air exchange rate is prescribed in the CAN/ULC-S774-09 protocol.
The predicted indoor air concentrations were then compared against the following thresholds:
- California Office of Environmental Health Hazard Assessment (OEHHA) Chronic Reference Exposure Levels (CRELs – defined as inhalation concentrations to which the general population, including sensitive individuals, may be exposed for long periods (10 years or more) without the likelihood of serious adverse systemic effects (excluding cancer));
- American Conference of Governmental Industrial Hygienists (ACGIH) Threshold Limit Values (TLVs) for Occupational Exposures, and 1/100 of the TLVs;
- US Occupational Safety and Health Administration (OSHA) Permissible Exposure Limits (PELs), and 1/100 of the PELs;
- American Industrial Hygiene Association (AIHA) Workplace Environmental Exposure Levels (WEELs), and 1/100 of the WEELs;
- For 4,4’-MDI, the US Environmental Protection Agency Reference Concentration (RfC)of 0.6 ug/m3. The RfC is for chronic inhalation exposure, and represents the airborne exposure to the human population (including sensitive subgroups) that is likely to be without an appreciable risk of deleterious effects during a lifetime.
- For formaldehyde, there is no generally accepted health-based threshold for non-occupational settings. Here are a few examples:
• California OEHHA CREL 9 ug/m3
• California OEHHA Indoor REL 33 ug/m3
• Health Canada Residential Indoor Air Quality Guideline 50 ug/m3
• World Health Organization Air Quality Guideline 100 ug/m3
• German Umweltbundesampt Indoor Air Limit 123 ug/m3
In addition, the US EPA is currently in the process of developing a RfC for formaldehyde. CLOSED CELL FOAM
Although Bayseal CC foam contains no added formaldehyde or acetaldehyde, low levels of these compounds were identified at all time points (see Table 1). Results shown are background- corrected, as small amounts of these aldehydes were identified in the background chamber. At no time were the predicted levels greater than the California OEHHA Indoor REL for formaldehyde. Acetaldehyde levels were well below the CREL at all time points.
TABLE 1. PREDICTED INDOOR AIR CONCENTRATIONS (0.3 air changes per hour) VERSUS TIME FOR FORMALDEHYDE AND ACETALDEHYDE FOR BAYSEAL CC.
| COMPOUND | THRESHOLD (ug/m3) | PREDICTED INDOOR AIR CONCENTRATION (ug/m3) AT INDICATED TIME (days) | ||||
| 0 | 0.5 | 1 | 2 | 4 | ||
| Acetaldehyde | 140 (CREL) | 69 | 64 | 44 | 37 | 28 |
| Formaldehyde | 33 (Indoor REL) | 9 | 12 | 0.1 | 15 | 5 |

FIGURE 1. Bayseal CC Foam - Predicted 1,1,1,3,3-Pentafluoropropane (blowing agent) indoor air concentrations (0.3 air changes/hour).
None of the three amine catalysts present in Bayseal CC foam was identified at or above the analytical quantitation limit at any time point. Similarly, MDI and pMDI were not identified at or above the analytical quantitation limit at any time point. This was true for both the PTFE-lined acrylic and stainless steel chambers. Sufficient sample volume was collected so that the analytical quantitation limit was less than the USEPA reference concentration (0.6 ug/m3).
OPEN CELL FOAM
Although Bayseal OC foam contains no added formaldehyde or acetaldehyde, low levels of these compounds were identified at all time points (see Table 2). Similar to Bayseal CC foam, the results shown are background-corrected, as small amounts of these aldehydes were identified in the background chamber. The predicted levels were greater than the California OEHHA Indoor REL for formaldehyde only at the first time point, and then subsequently declined to below the Indoor REL. The acetaldehyde level was just below the CREL at the first time point, but then fell well below it at all subsequent time points.
TABLE 2. PREDICTED INDOOR AIR CONCENTRATION (0.3 air changes per hour) VERSUS TIME FOR FORMALDEHYDE AND ACETALDEHYDE FOR BAYSEAL OC.
| COMPOUND | THRESHOLD (ug/m3) | PREDICTED INDOOR AIR CONCENTRATION (ug/m3) AT INDICATED TIME (days) | ||||
| 0 | 0.5 | 1 | 2 | 4 | ||
| Acetaldehyde | 140 (CREL) | 139 | 26 | 20 | 9 | 4 |
| Formaldehyde | 33 (Indoor REL) | 37 | 15 | 7 | 6 | 9 |
Two of the three amine catalysts in Bayseal OC foam were not identified at or above the analytical quantitation limit at any time point. A third amine catalyst (Amine A) was identified at all time points, finally declining to levels below the analytical limit of quantitation at day 20 (see Figure 2). There is no CREL or occupational exposure limit (OEL) for this particular amine. However, a similar amine compound that does have an OEL was identified. The identified levels of Amine A slightly exceeded 1/100 of the surrogate amine OEL through approximately day 5, and then fell below this level. As mentioned, the levels dropped below the analytical limit of quantitation at day 20.

TABLE 3. PREDICTED INDOOR AIR CONCENTRATION (0.3 air changes per hour) VERSUS TIME FOR CHLOROBENZENE, 1,2-DICHLOROPROPANE, 1,4-DIOXANE, and ISOPROPYL ALCOHOL FOR BAYSEAL OC.
| COMPOUND | THRESHOLD (ug/m3) | PREDICTED INDOOR AIR CONCENTRATION (ug/m3) AT INDICATED TIME (days) | |||
| 0 | 0.5 | 1 | 2 | ||
| Chlorobenzene | 1000 (CREL) | 1574 | 827 | 507 | 203 |
| 1,2- Dichloropropane | 462 (1/100 OEL) | 276 | 92 | 21 | 15 |
| 1,4- Dioxane | 3000 (CREL) | 1479 | 663 | 201 | 40 |
| Isopropyl Alcohol | 7000 (CREL) | 733 | 183 | 27 | 8 |
CONCLUSIONS & RECOMMENDATIONS
Based on the data developed through this work, the following re-occupancy times are prescribed for both Bayseal OC and Bayseal CC foams:
- 12 hours following the end of spraying for trades workers,
- 24 hours following the end of spraying for all others (e.g., residents, tenants, etc.)
The justification for these recommendations is as follows. At approximately 12 hours, the predicted airborne levels of all identified compounds were significantly less than the applicable OELs. At approximately 24 hours, the predicted airborne levels of all identified compounds were less than the CREL, Indoor REL (formaldehyde), or, in the absence of a CREL or Indoor REL, 1/100 of the OEL. The only exception to this was for one amine catalyst for Bayseal OC foam. However, the presence of the amine catalyst at levels only slightly greater than 1/100 of the surrogate amine OEL through approximately day 5 does not appear to be reason for concern because: 1) the initial levels only marginally exceeded 1/100 of the OEL for the surrogate compound; 2) the critical health effect for the amine is primarily transient irritation; and 3) the levels were demonstrated to decline with time falling below the conservative (health protective) benchmark of 1/100 of the OEL in less than a week.
A longer re-occupancy time for populations other than trades workers (24 hours vs. 12 hours) is thought to be appropriate, as such groups can include sensitive populations which include infants, children, the elderly, and persons who are health-compromised.
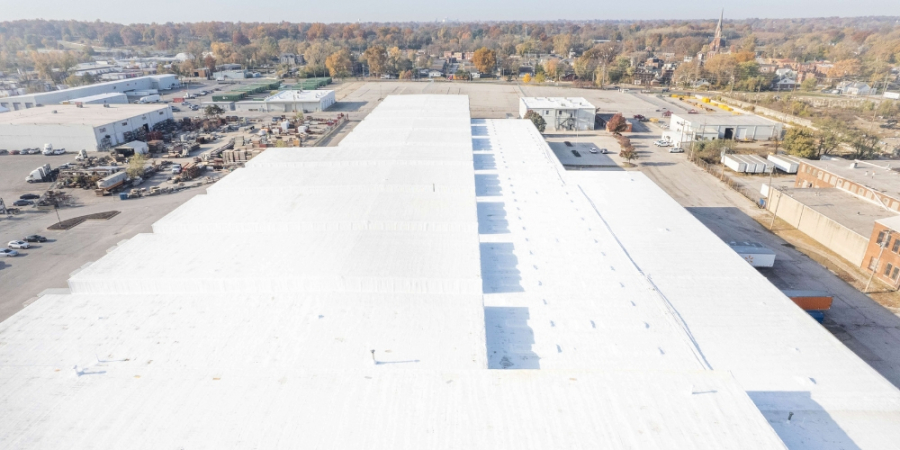
It should also be recognized that when building occupants return to the structure at 24 hours following the end of spraying or later, there will typically be a barrier between the installed SPF and the occupants, such as drywall walls and/or ceiling. Therefore, the predicted indoor air concentrations presented in this work may be higher than in real-world scenarios.
During the 24 hour post-spray period, the spray area should be ventilated at a minimum of one air exchange per hour. Ideally, the spray area should be ventilated in a manner to encourage flushing of the entire spray area, for example by introducing air at one side and exhausting it at the other side via a fan(s). Access to the area near the fan discharge point should be restricted, and care should be taken to avoid discharging near outdoor air intakes. This ventilation technique should permit aerosols and vapors released as a result of spraying to be purged from the structure, as well as assist with the removal of chemicals emanating from the newly installed foam. This ventilation should also help reduce airborne concentrations for trades workers who may be in the spray area beginning 12 hours following the end of spraying.
It is also important to note that the 24-hour re-occupancy guideline assumes there will be at least 0.3 air changes per hour in the structure following the ventilation period.
A commonly prescribed re-occupancy guideline in the SPF industry is 24 hours. The data developed for Bayseal OC and CC foams support this rule of thumb. However, re-occupancy guidelines are product specific and should be developed based on data obtained through an emissions testing procedure similar to what is described in this paper.
CONSIDERATIONS FOR FUTURE STUDY
Additional items that may warrant investigation include: 1) Field validation of the 12- and 24-hour re-occupancy recommendations, 2) the impact of elevated temperature on emission characteristics of Bayseal CC and OC, and 3) the effect of drywall or other barrier material on predicted indoor air concentrations.
Disqus website name not provided.